Visualizing Ukraine’s Top Trading Partners and Products
Putting EV Valuations Into Perspective
Mapped: Corruption in Countries Around the World
A Visual Guide to Stock Splits
Visualizing the State of Global Debt, by Country
How the Top Cryptocurrencies Performed in 2021
The 20 Internet Giants That Rule the Web
Visualizing the Power of the World’s Supercomputers
Companies Gone Public in 2021: Visualizing IPO Valuations
A Visual Guide to Profile Picture NFTs
Visualizing the State of Global Debt, by Country
This Infographic Breaks Down Careers In Finance, From Hedge Funds to M&A
Visualizing the $94 Trillion World Economy in One Chart
How Central Banks Think About Digital Currency
The Richest Women in America in One Graphic
Visualizing How COVID-19 Antiviral Pills and Vaccines Work at the Cellular Level
Mapped: The Most Common Illicit Drugs in the World
Visualizing The Most Widespread Blood Types in Every Country
Pandemic Recovery: Have North American Downtowns Bounced Back?
Ranked: The Most Prescribed Drugs in the U.S.
Breaking Down the Cost of an EV Battery Cell
The Future of Global Coal Production (2021-2024F)
Ranked: The Top 10 Countries by Energy Transition Investment
Charted: $5 Trillion in Fossil Fuel Subsidies
Visualizing China’s Dominance in Clean Energy Metals
4 Historical Maps that Explain the USSR
Map Explainer: Key Facts About Ukraine
Mapped: The World’s Major Religions
Mapped: 30 Years of Deforestation and Forest Growth, by Country
Mapped: The Most Common Illicit Drugs in the World
The 50 Minerals Critical to U.S. Security
Visualizing China’s Dominance in Clean Energy Metals
The Periodic Table of Commodity Returns (2012-2021)
Visualizing the Abundance of Elements in the Earth’s Crust
Rare Earth Elements: Where in the World Are They?
Putting EV Valuations Into Perspective
Visualizing the World’s Biggest Rice Producers
Ranked: The Top 10 Countries by Energy Transition Investment
Visualizing China’s Dominance in Clean Energy Metals
Ranked: Nuclear Power Production, by Country
Published
on
By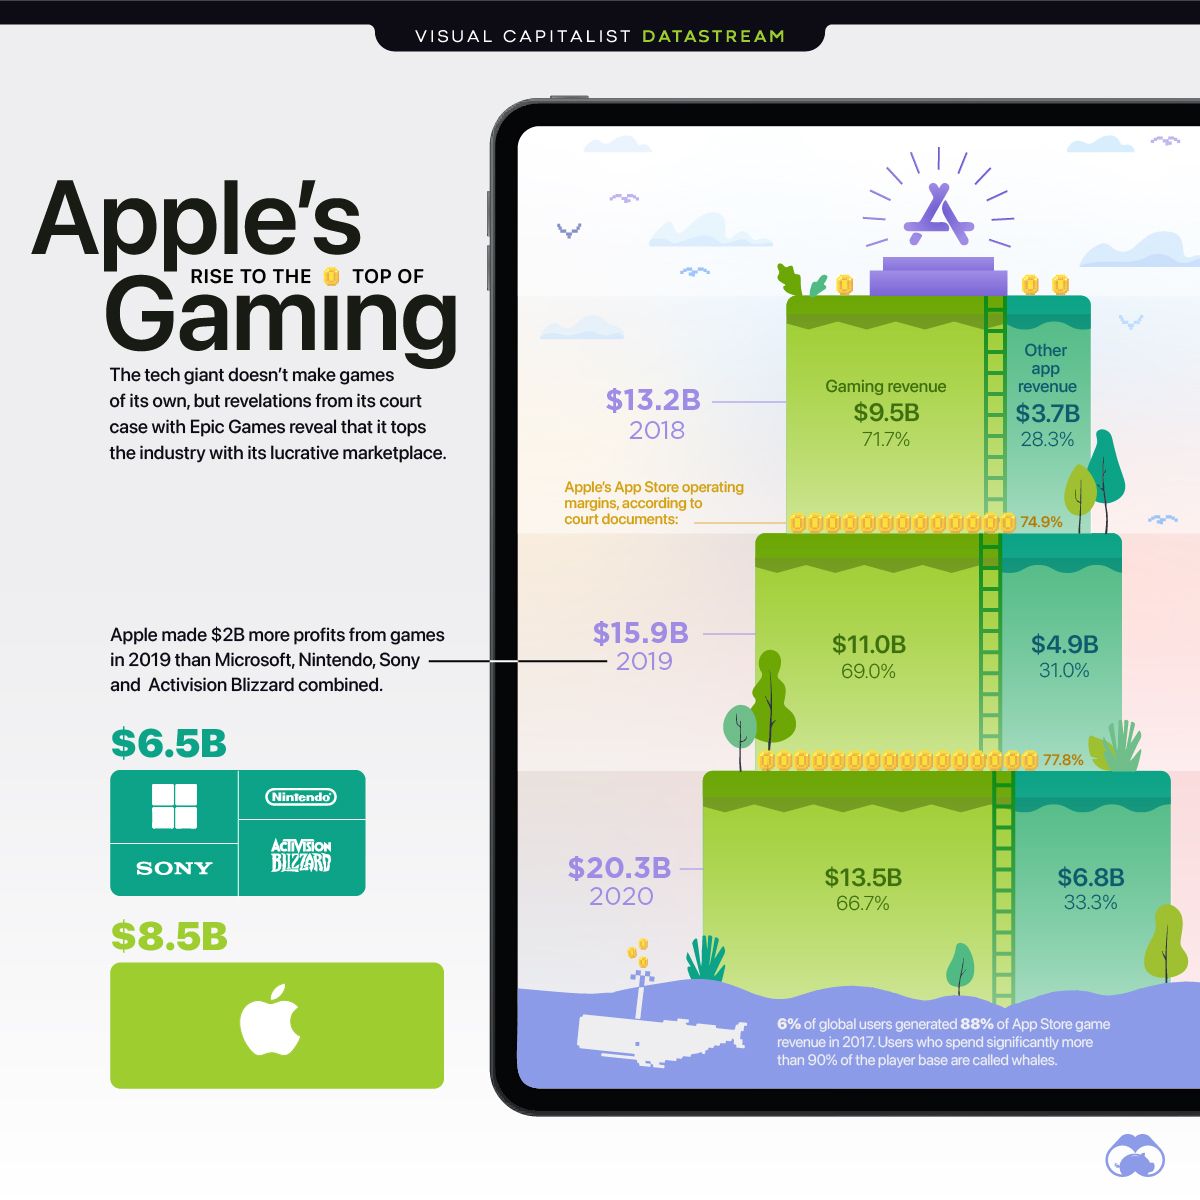


In 2020, Apple generated an estimated $13.5 billion dollars in gaming revenue—even though the tech giant doesn’t actually make any games or gaming consoles.
So how does Apple generate all this money from gaming? A key driver of Apple’s gaming revenue is the 30% fee it collects from all app spending, including in-app purchases, subscriptions, and premium app fees.
Through this significant fee structure, Apple has seen its gaming revenue steadily increase over the last few years. Here’s a look at the company’s estimated gaming revenue from 2018 to 2020:
Note: For fiscal years ending in September
As the data above shows, a majority of Apple’s App Store revenue comes from games. And because of hefty fees, Apple made more profits off of games than some of the most reputable gaming companies who designed them.
For example, in 2019, Apple generated $2 billion more in operating profit than Nintendo, Microsoft, Sony, and Activision Blizzard—combined.
The 30% fee is a financial burden for game developers who sell large volumes of in-app purchases. So, in an attempt to bypass Apple’s in-app payment systems, some developers have tried to redirect users to external payment platforms (a competitive tactic called envelopment).
Epic Games tried a version of this by integrating their own payment system into Fortnite. However, Apple then removed Fornite from the App Store, citing violations to the terms of their agreement. In response, Epic Games countered with a lawsuit, accusing Apple of monopolistic practices and antitrust violations.
While Apple ended up winning a majority of the court case, the tech giant was ordered to update their App Store policies, meaning Apple could no longer prohibit gaming companies from directing customers to alternative means of payment.
»>>Like this? Then you might enjoy this article on The History of Gaming, by Revenue Stream
Where does this data come from?
Source: Sensor Tower, via the Wall Street Journal
Visualizing Amazon’s Rising Shipping Costs
A Visual Guide to Stock Splits
Visualizing The Global Semiconductor Supply Chain
From Amazon to Zoom: What Happens in an Internet Minute In 2021?
The World’s 100 Most Valuable Brands in 2021
Ranked: Big Tech CEO Insider Trading During the First Half of 2021
Mapping The Biggest Companies By Market Cap in 60 Countries
Amazon’s shipping costs have surged to over $150 billion – a number that has almost doubled since the start of the pandemic.
Published
on
By
Most investors would agree that Amazon has been a winner during the COVID-19 pandemic. After all, in two short years from 2019 to 2021, sales soared to $469 billion from $280 billion and their market cap surged towards a $1.7 trillion valuation.
But even the best of companies have had to navigate choppy waters and uncertainty during this time. For Amazon, this has come in the form of cost pressures in their shipping and fulfillment department, which are now representing an increasingly large share of revenues.
Just how large are Amazon’s shipping and fulfillment costs becoming?
In 2021, shipping and fulfillment costs added up to $151.8 billion. Shipping, which includes sortation, delivery centers, and transportation costs amounted to $76.7 billion. Fulfillment costs, which include cost of operating and staff fulfillment centers, were $75.1 billion.
As a result of these trends, Amazon’s shipping and fulfillment expenses now represent 32% of their revenues:
| Year | Cost as a % of revenue |
|---|---|
| 2021 | 32% |
| 2020 | 31% |
| 2019 | 28% |
| 2018 | 27% |
| 2017 | 26% |
| 2016 | 25% |
| 2015 | 23% |
| 2014 | 22% |
| 2013 | 20% |
| 2012 | 19% |
| 2011 | 18% |
As you can see, costs are escalating, and today’s figure is almost twice that of the 18% figure seen in 2011.
While these expenses are rising, it’s important to remember that Amazon’s profits are still healthy. They generated $33 billion in profits for 2021. One reason for this is that the majority of Amazon’s profits never came from ecommerce to begin with. Amazon Web Services (AWS), which is a much higher margin segment of their business, accounts for over 50% of their operating profits, but only 13% of their sales.
AWS is such a profit generating machine that prominent investors have called for Amazon to spin off AWS into its own entity. They argue that pure play technology companies are often assigned a higher equity multiple, and spinning off AWS would be accretive to shareholder value.
The $151.8 billion in expenditures towards shipping and fulfillment is absolutely massive. On a per minute basis, this results in $288K per minute in expenses, compared to their $956K in revenue per minute.
Another way to put this gargantuan figure to scale is to remember that this business expense is greater than the equity value of about 90% of all companies in the S&P 500.
Where does this data come from?
Source: Statista
Notes: Fulfillment costs include customer service centers and payment processing costs
What’s the lowest-carbon way to travel? Here’s how much CO2 different types of vehicles emit per passenger-kilometer.
Published
on
By
As concern about climate change has grown, individuals are becoming increasingly conscious of their impact on the environment.
Transportation emissions often make up the largest portion of our individual carbon footprints. For that reason, evaluating transport options is a natural place to start, whether it is for a daily commute or a leisure trip abroad.
So, what’s the most eco-friendly way to go from one place to another?
The above infographic charts the carbon footprint of transportation per passenger-kilometer for different vehicles based on data from the UK Government’s methodology paper for greenhouse gas reporting.
Editor’s note: Because the original labels in the study are very UK-specific, we have changed the copy of some of the labels to better suit an international audience.
The carbon footprint of transportation is measured in grams of carbon dioxide (CO2) equivalents emitted per person to travel one kilometer. This includes both carbon dioxide and other greenhouse gases.
Here’s how the carbon cost of travel compares for different means of transport:
Flying on a short flight or driving alone are the most carbon-intensive travel methods. However, adding one more passenger to your car ends up cutting the emissions in half, making driving more efficient.
Specifically, it’s worth breaking down categories of flights more, as their emissions depend greatly on their route length:
Why are longer flights far more eco-friendly than short-range flights? It’s because take-off uses much more energy than the ‘cruise’ phase of a flight. For short flights, the efficient cruise phase is relatively short-lived.
As the world works to mitigate the impact of climate change, people may want to identify and potentially reduce their daily carbon footprint. And choosing your method of transportation is one way to do so.
Of course, walking, biking, or running are the lowest-carbon ways to go from one place to another. But car-sharing can also reduce emissions, as can switching to electric vehicles or public transport.
Over medium-to-long distances, trains are the most eco-friendly option, and for short-range domestic travel, driving is better than taking a flight. But as some countries are bigger than others, always consider the total distance you need to travel, and the breadth of options you have available.
Where does this data come from?
Source: UK Department for Business, Energy & Industrial Strategy, Our World in Data
4 Historical Maps that Explain the USSR
Map Explainer: Key Facts About Ukraine
Mapped: The World’s Major Religions
Mapped: Corruption in Countries Around the World
Comparing the Carbon Footprint of Transportation Options
American Companies That Failed in China
Ranked: The Life Expectancy of Humans and 49 Other Animals
A Visual Guide to Stock Splits
Copyright © 2021 Visual Capitalist


 de Juego de Tronos(Game of Thrones)")